


Homepage
•
Learning Library
•
Blog
•
Infographic: ISTE 2015 by the numbers
Expand breadcrumbs
- Learning Library
- Blog
- Infographic: ISTE 2015 by the numbers
- Homepage
- •
- Learning Library
- •
- Blog
- •
- Infographic: ISTE 2015 by the numbers
Infographic: ISTE 2015 by the numbers
Every year, tens of thousands of educators come together at the ISTE Conference & Expo to discover new ways to use educational technology to engage their students and enhance learning. As you might imagine, it's a sight to behold. Everywhere you look, people are in movement. They're getting inspiration from powerful speakers, interacting with ed tech experts, collecting assorted swag, getting hands on with cool gadgets in playgrounds and workshops, tweeting and posting about what they've learned, connecting with old friends, and making new ones. They're constantly learning something new, and they are clearly excited about it.
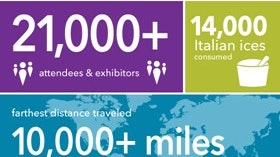
This year, nearly 16,000 attendees traveled from 76 nations around the world to Philadelphia for ISTE 2015. Check out the infographic below for a breakdown of some of the awe-inspiring stats that result when so many passionate educators gather in one place for a common cause.